[OpenShift 監控系列 - 1] OpenShift Prometheus 的 3 種部署模式
最近碰到個專案是想把既有的 MVC 應用程式打包,並且部署到 OpenShift 上面。
在經歷各種
本系列要談的主題會偏向
🌼 OpenShift Prometheus 的 3 種部署模式
🌼 用 Sidecar Container 收 Apache 的 Log
🌼 自己寫 Prometheus Metrics 收 Prometheus Metrics
而今天會介紹第一個主題 -
環境:
🌿 OpenShift 4.7
🌿 Prometheus Operator: 0.44.1
🌿 Thanos: 0.17.2.
🌼 OpenShift Prometheus 的 3 種部署模式
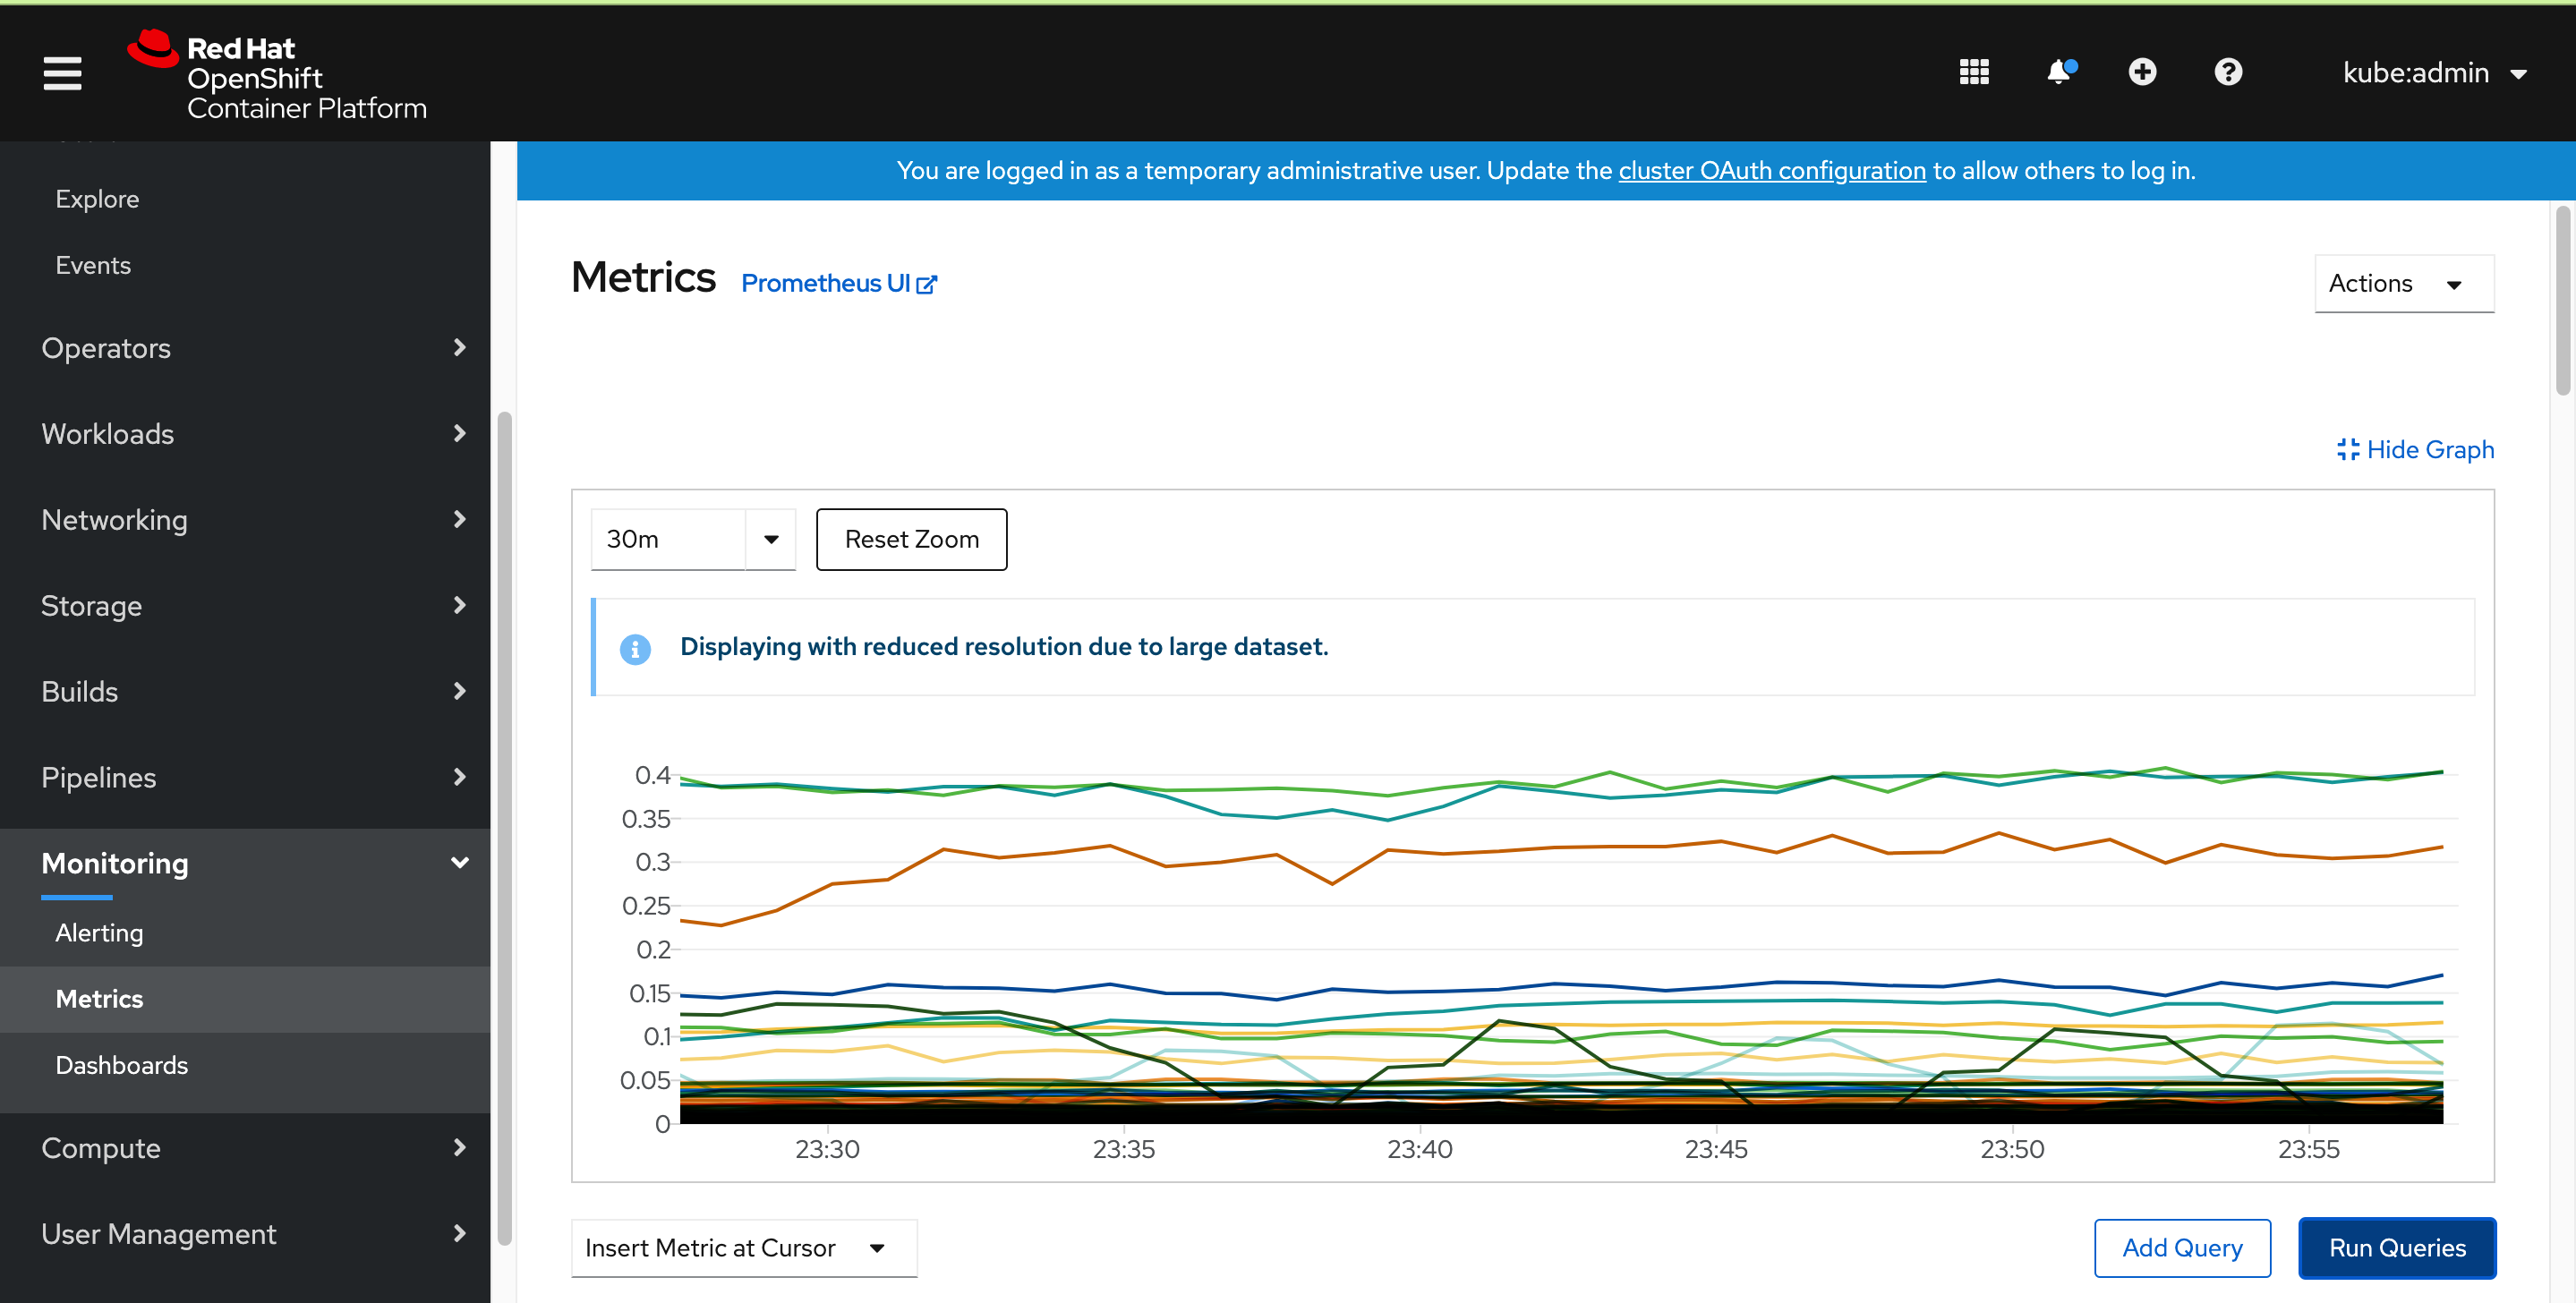
OpenShift 原生已經自帶 Metrics 這個 Tab,打開就可以看到 Prometheus Metrics Dashboard
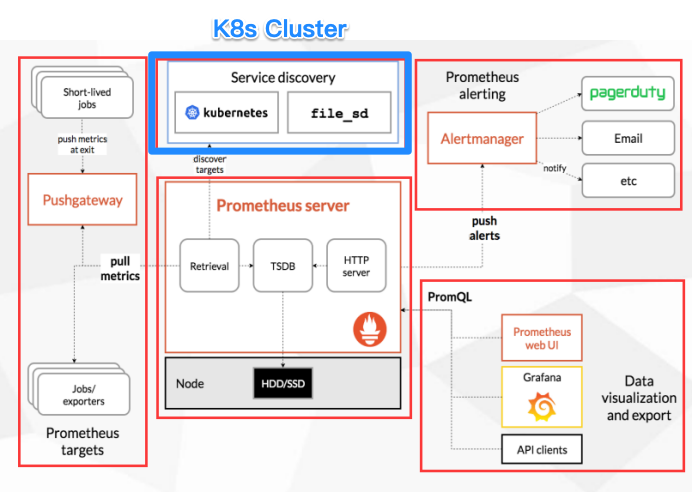
OpenShift Cluster 本身的 Metrics 都會 Prometheus Operator 部署的 Prometheus Server 收走,架構圖如下: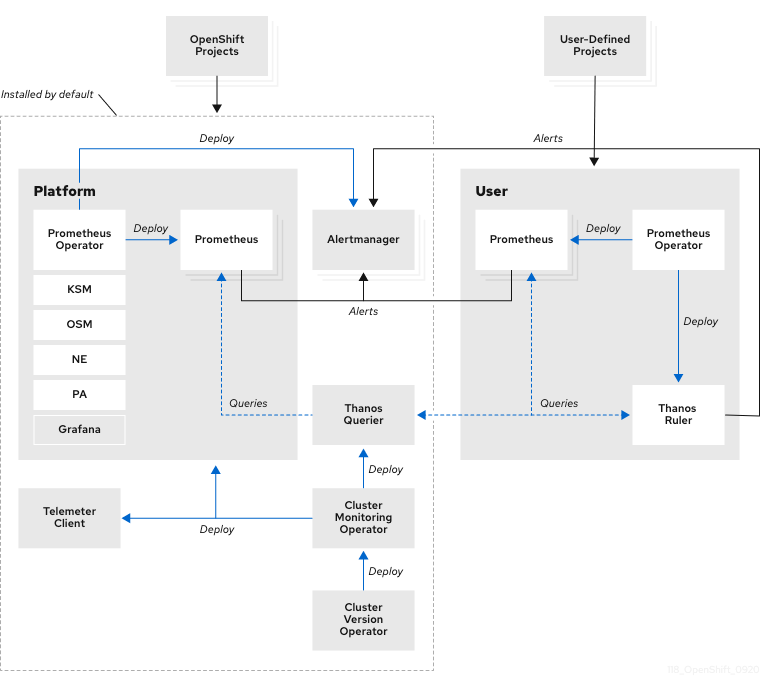
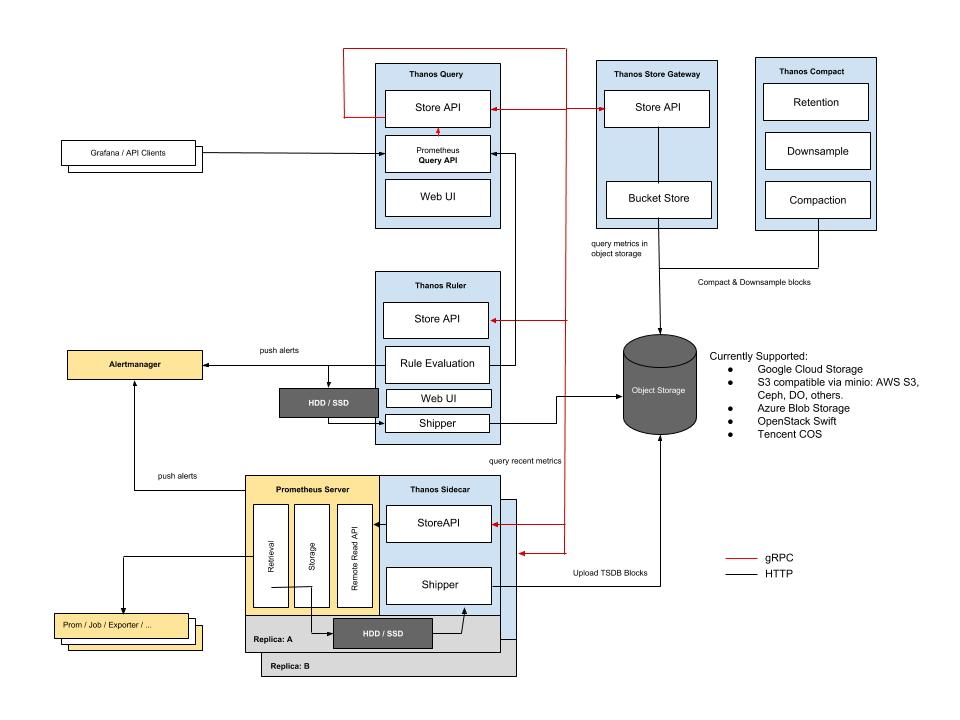
可以看到圖中的 Thanos Querier 元件會負責查詢所有節點的 Metrics,並負責將重複的 Metrics 透過 Deduplicate & Merge 的功能認出散落在不同的 Prometheus 上 Label 相同的 Metrics,並且把重複的 Metrics 去掉之後,顯示在 Dashboard 上面,其中的原理可以參考底下來自
OpenShift 所有關於 Metrics 的元件都可以在
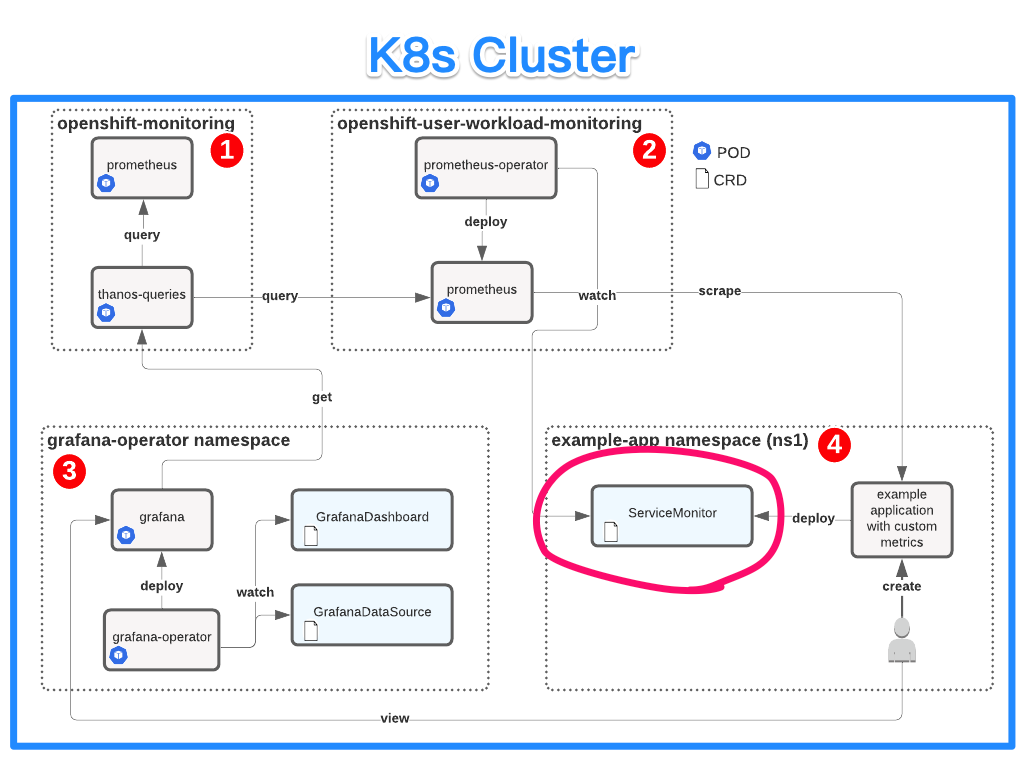
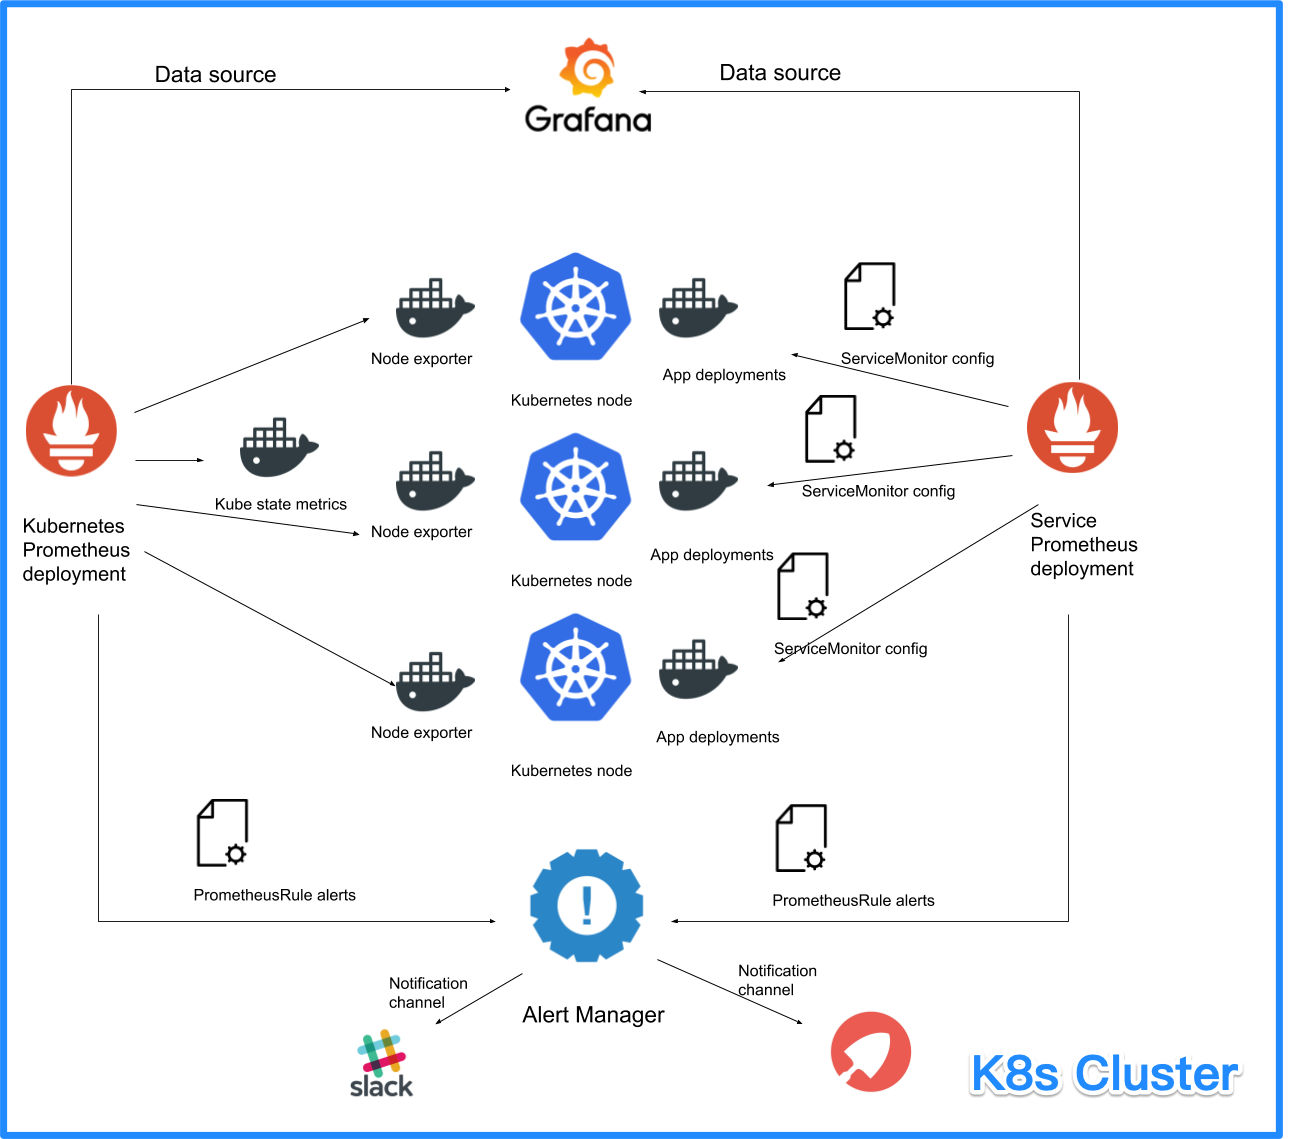
針對 OpenShift 上自行開發的 Pods 主要有 3 種部署 Prometheus 的模式可以收 Metrics:
| 模式 | 說明 | 適用場域 | 圖解 |
|---|---|---|---|
撰寫 Customize Query Metrics,並且於 Developer > Metrics > Custom Query在目標服務( targetCR |
開發者會自行撰寫 Prometheus Metrics / 熟知 Prometheus Metrics Exporter 建置方法、收集 Metrics / 會寫 Sidecar 收穫 Metrics |
 |
|
部署 Customize Prometheus Operator透過部署 Prometheus Operator 的方式把不同 Project 或是不同 service 的 targets 透過不同的 Prometheus Server 管理。 |
比較大規模的組織,特別是需要各部門針對自己的應用收集 Metrics 的情況,建立獨立部署 Prometheus Operator,但是要注意資源的使用量以及建置文件的配置。 |
 |
|
部署 PrometheusPrometheus Server 獨立於 OpenShift Cluster 之外。 |
資源較為不足 / 對於監控的 Metrics 有保存的需求,需要特別獨立出來做管理的組織。 |
 |
這三種模式,我都各自附上了建置的參考文件,有興趣動手實作的人可以自行建置,下面提到的範例程式以及操作僅限於 Custom Query 以及 Custom Prometheus Operator 這兩種模式。
🌼 Reference
🌟 Understanding the monitoring stack
🌟 Coscup 分享 - HA Prometheus Solution Thanos
🌟 GitHub - Thanos
🌟 利用 Grafana Operator 部署 Grafana 到 OpenShift,並建立客製化的 Dashboard。
🌟 集群外独立部署Prometheus+Grafana监控K8S全面解析
🌟 OpenShift 4.3 之 Quarkus(3)用独立的Prometheus监控Quarkus应用
🌟 Kubernetes Operations and Maintenance Using Prometheus Overall Monitoring K8S
🌟 FIRST STEPS WITH PROMETHEUS