[OpenShift 監控系列 - 2] 用 Sidecar Container 收 Apache 的 Log
承襲上篇系列文 -
🍁 API Service 透過 Webform 等等的框架包起來,呼叫 API 等等的行為都是透過 GUI 手動操作
🍁 程式是由第三方開發,對於 API 規格並不清楚
🍁 你需要收集 API 相關資訊,並彙整到視覺化的工具上,比方說固定時間內的 API 呼叫次數、API 的回應延遲時間
🐥 前情提要 - RESTful API 推廣
最近因為本人因需求要在不改動程式的情況下,收集 API 的呼叫資訊。
在一番寒徹骨的研究之下,發現透過應用的工具呼叫系統 API 時,會有 API 名稱,只是一般來說 API 名稱會設計在 URL segments 上面,而這個應用是把 API 名稱包在 Webform 的 POST data 裡面。
如果對 RESTful API 有興趣的人,我非常推薦參考 Learn REST: A RESTful Tutorial,這篇文章用簡單陳述 RESTful API 的設計要點,讓讀者知道設計 REST API 的標準和方法。文章中也有點出好的/比較不好的 API 設計範例,比方說:
1 | # 在 URL 使用標識符(identifiers)而不是使用查詢字串(query string)去要求資源。使用 URL 查詢字符串當參數非常適合過濾要查詢的資源/資料,但不適合當作資源名稱。 |
Google Chrome 有 Inspector可以觀察呼叫 API 所發出的 Request & Response,我就是用 Inspector 把 API 的 Request 錄下來,並且使用 Postman 這個 API 開發超好用的神器進行測試。
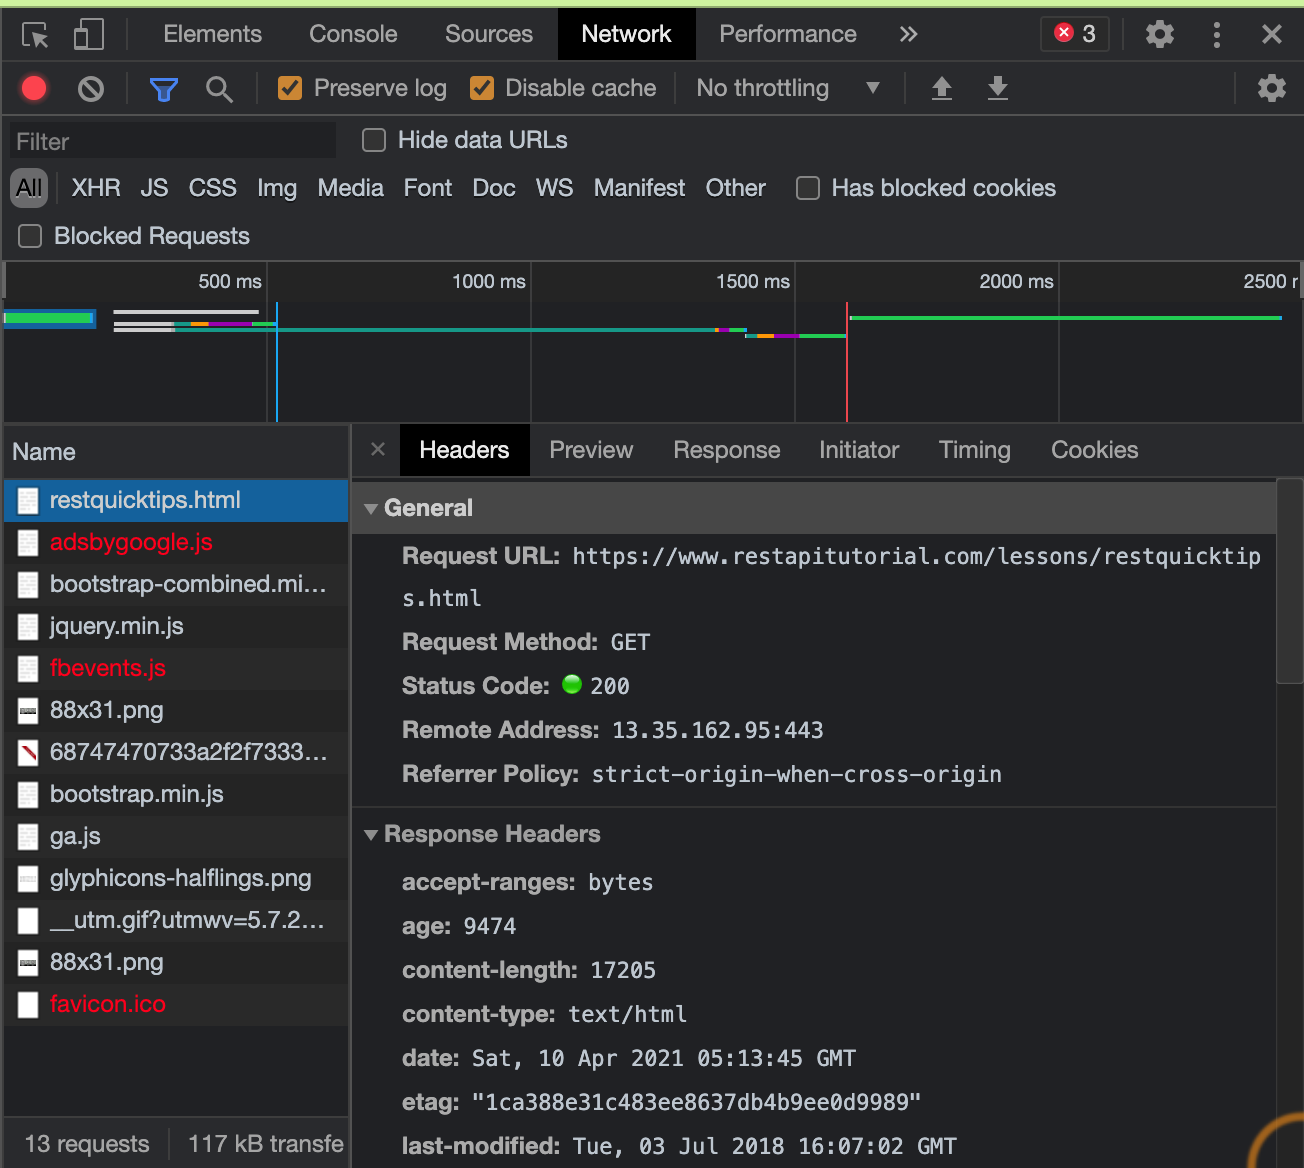
⬆️ Google Chrome Inspector 示意圖
設計完 REST API,如果需要寫 API 文件或者是進行測試,也非常推薦使用 Swagger UI。不僅可以讓 API 更容易被不是開發者的人了解和使用,如果團隊有新成員加入,一份好的 API 文件可以加速新成員上手的速度。
🐥 正文開始 I - 如何收集 Apache 的 Log 並且格式化成自己想要的格式
環境:
🌿 OpenShift 4.7
🌿 Prometheus Operator: 0.44.1
🌿 Thanos: 0.17.2.
🌿 Postman v8.2.1
🌿 Grok Exporter 1.0.0.RC5
這個應用是用 Apache 提供 Web Service 的,查看設定檔之後,發現可以通過解析 access_log 的方式,比方說透過 tail 指令可以看到每一個 request 的細節。
1 | tail -100 /etc/httpd/logs/access_log |
比較特別的是 webform 裡面所有的 request 都會透過 Apache 來處理,所以光是看 access log 就可以知道程式還會根據 Post data 對應的 API Name 再對 Apache 做一次 request,所以光是統計一段時間內有多少條相同 API Name 的紀錄,就可以知道這隻 API 被呼叫多少次。
要如何解析 access_log 呢?可以看看 /etc/httpd/conf/httpd.conf,Apache 的設定檔裡面有沒有這個模組 mod_log_config
先在 httpd.conf 設定檔內加入設定(或移除註解)
1 | LoadModule log_config_module modules/mod_log_config.so |
可以看到底下會有預設的 log_config_module 設定檔案
1 | LogLevel warn |
可以根據需要拿的資訊做改寫,比方說這個設定:
1 | LogFormat "%h %l %u %t \"%r\" %>s %b \"%{Referer}i\" \"%{User-Agent}i\"" combined |
出來的 log 結果就會長這樣:
1 | source IP - admin [01/Aug/2016:19:23:45 +0800] "GET / HTTP/1.1" 401 670 "http://xxx.com/" "Mozilla/5.0 (Windows NT 5.1; rv:9.0.1) Gecko/20100101 Firefox/9.0.1" |
🐥 II - 如何將格式化後的 Apache Log 變成 Prometheus Metrics
知道如何格式化 Apache log 之後就要思考如何把這些 Log 變成 Prometheus Server 看得懂的 Log,這邊我們就要會使用到 exporter 這種專門轉換 log 的工具。
在 Prometheus 官方的列表 中可以看到有各種第三方或是原廠開發的 exporter,可自行參考取用。
因為要轉換的是 Apache 的 log,所以我們會使用到 grok exporter,架構大致如下圖:
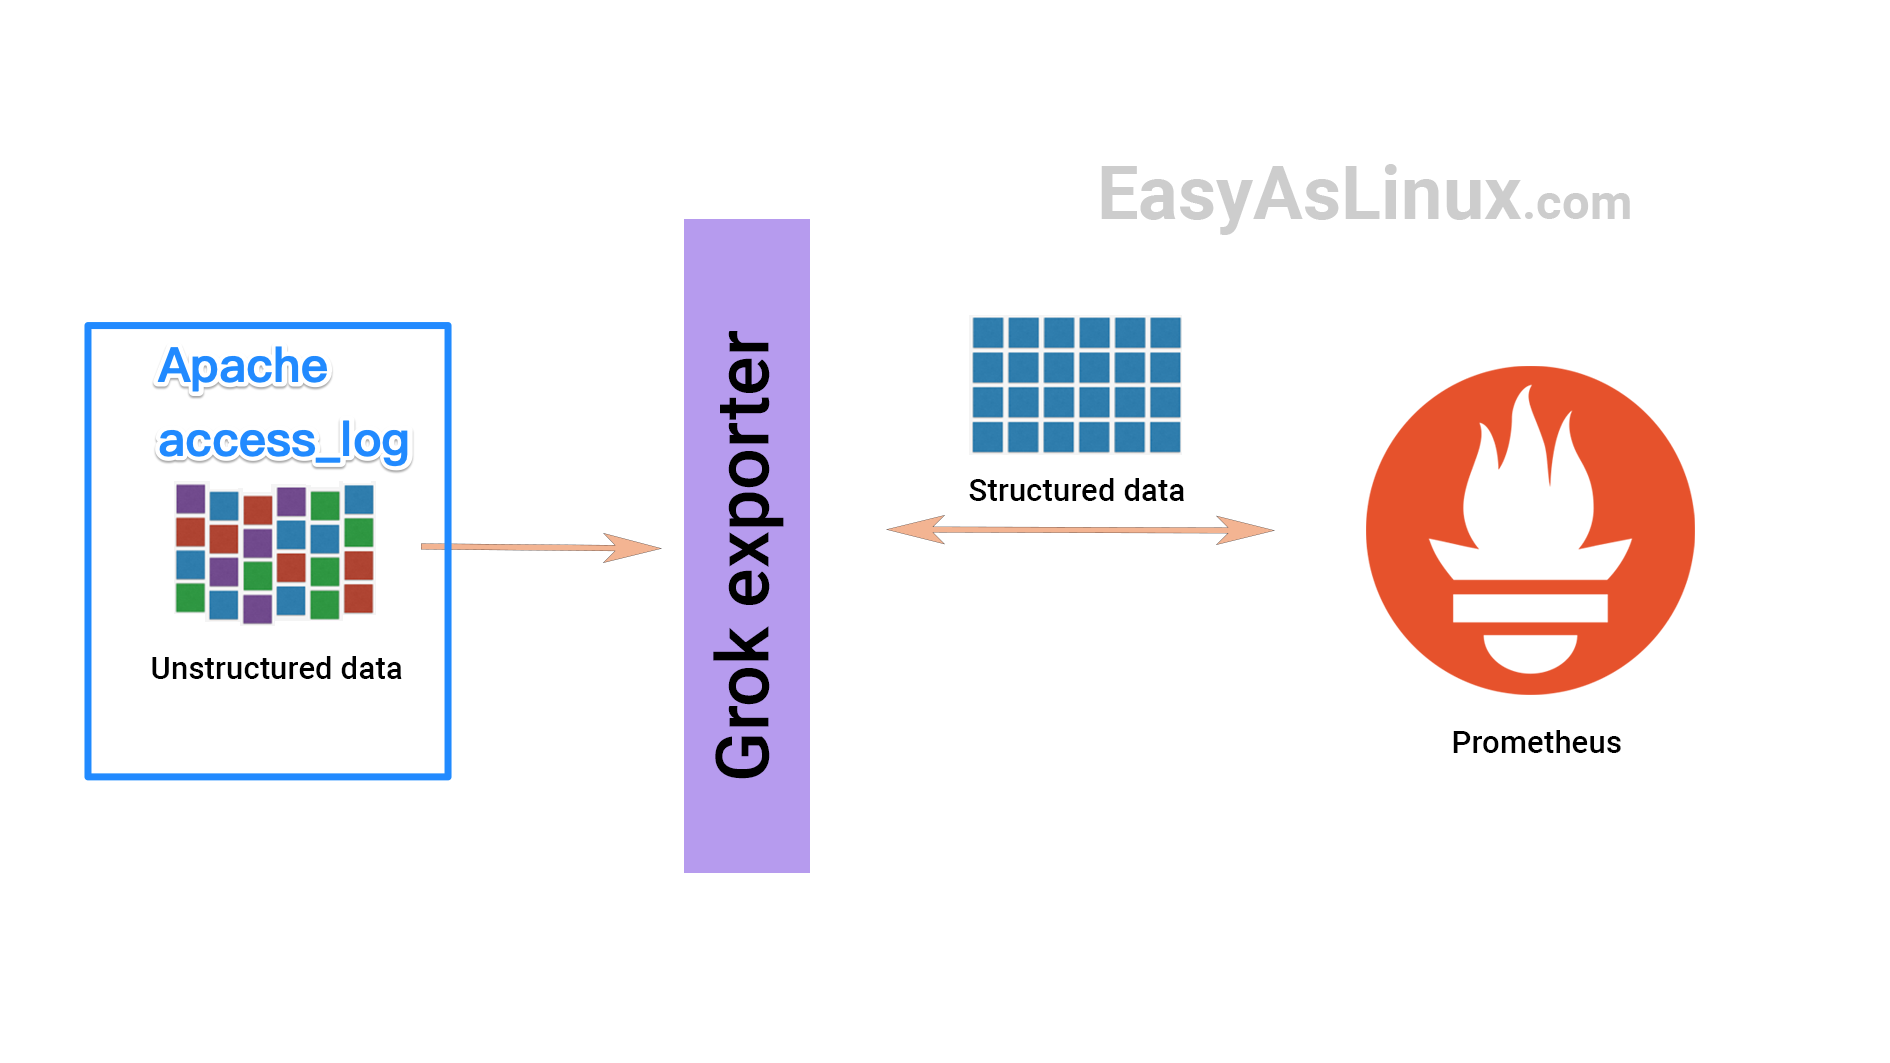
因為我是用 OpenShift 進行應用程式的部署,grok exporter 也要部署於 OpenShift 上,這邊就要思考如何讓 Apache 可以和 grok exporter 寫入和讀取到同一份 access_log,順序如下:
- Apache 把 log 寫到 access_log 這個檔案
- grok exporter 解析 access_log 變成 Prometheus 能夠用的 Metrics
- 部署
K8s Deployment&K8s Service - 部署
Service Monitor作為 target,讓 Prometheus Server 可以週期性(15s ~ 30s)的拉 Metrics
這邊當然可以用 PV/PVC 的方式 Volume,但本人光陰有限,火燒屁股,所以決定把塞咖(sidecar)模式搬出來用,所以 access_log 的部分就先用 local path 的方式連動,K8s deployment 大致上會長這個樣子:
1 | volumes: |
上面做法是把 grok exporter 的設定檔案拉出來變成 configMap,不然每次測試都要進到 terminal 去改,不如重新部署後 rollout 最快,設定檔大致上如下:
1 | kind: ConfigMap |
K8s Service 這邊不贅述,最後一個是 Service Monitor,因為我是用在同個 OpenShift Project 下部署 Prometheus Operator 的方式處理,所以透過同個 Operator 部署以下 Service Monitor CR 的方式可以對同個 Prometheus Server 新增 Prometheus target。
1 | apiVersion: monitoring.coreos.com/v1 |
到 Prometheus 的 Dashboard 上查看,有起來就可以 query 看看,拍謝這邊找不到當初的原圖,隨意放個示意圖讓大家看看。
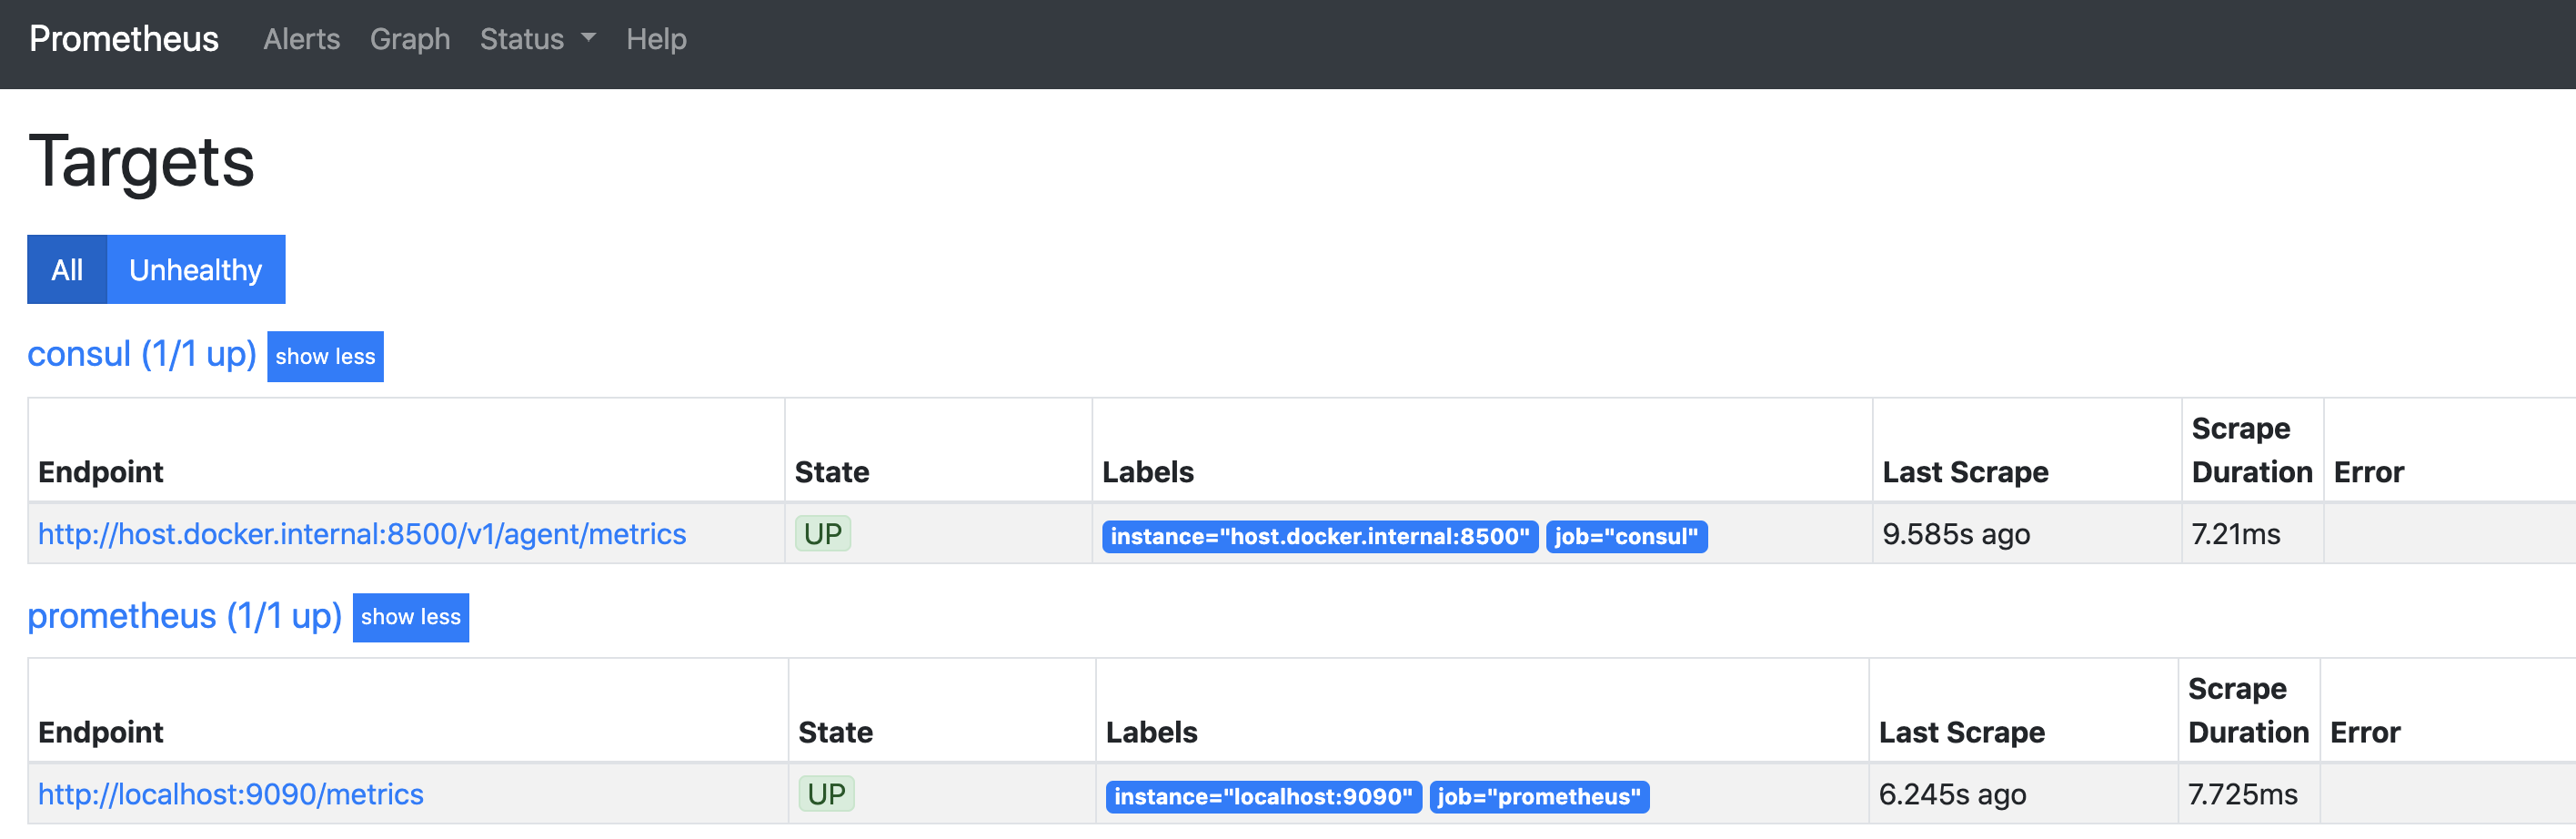
然後 query 一下剛剛定義的 Metrics apache_http_response_codes_total 在 Dashboard 有沒有數值進來,有的話就成功了。
🐥 特別超感謝 Special Thanks
特別超感謝同事
🐥 Reference
🌟 API 到底是什麼? 用白話文帶你認識
🌟 Getting started with the REST API
🌟 Learn REST: A RESTful Tutorial
🌟 Swagger UI
🌟 Apache Server 相關設定
🌟 Apache Module mod_log_config
🌟 Prometheus - EXPORTERS AND INTEGRATIONS
🌟 How to use grok exporter to create prometheus metrics from unstructured logs